Difference between revisions of "Dissemination follow-up"
| (45 intermediate revisions by 2 users not shown) | |||
| Line 1: | Line 1: | ||
<small>''Page's last update : 22 February 2024''</small> | |||
__TOC__ | |||
= FAQ = | |||
'''Dashboard''': | <span class="mw-customtoggle-q0" style="font-weight:bold;line-height:2.5;">Your module is greyed out?</span> | ||
Set of graphs providing statistics related to products, dissemination, dissemination status and instruments | <div class="mw-collapsible mw-collapsed" id="mw-customcollapsible-q0"> | ||
::To get access to this module, please ask your e-file local administrator to [[E-file Administration#Assign groups and profiles to users|make you member]] of the '''''Dissemination dashboard''''' group. | |||
::[[File:DissFollow GreyedOut.png|alt=Dissemination follow-upis greyed out.|thumb|To have access : '''''Dissemination dashboard''''' group ]] | |||
</div> | |||
<span class="mw-customtoggle-q1" style="font-weight:bold;line-height:2.5;">What is the purpose of this module ?</span> | |||
<div class="mw-collapsible mw-collapsed" id="mw-customcollapsible-q1"> | |||
::The objective of this module is to give you an overview of the disseminations done. The information are split between two screens: | |||
::'''Monitoring''': | |||
::*List of the dissemination with status, date and time, type of data, and possibility to download the file | |||
::*If you click on one specific line, you have access to the dissemination details such as the distribution channel, the recipient list, the format of the file and the reference of the dissemation (subscription number and name and contract number and name) | |||
::'''Dashboard''': | |||
::Set of graphs providing statistics related to products, dissemination, dissemination status and instruments | |||
</div> | |||
<div style="text-align: center; width:100%;border-style: double none none none;"> </div> | |||
=How to access the Dissemination follow-up screen= | =How to access the Dissemination follow-up screen= | ||
| Line 14: | Line 29: | ||
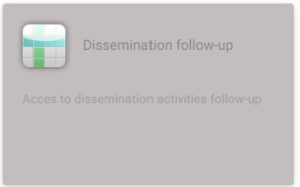
'''Step 1''': Click on the Dissemination follow-up icon | '''Step 1''': Click on the Dissemination follow-up icon | ||
[[File:Click on the Dissemination follow-up icon.png | border | | [[File:Click on the Dissemination follow-up icon.png | border | 1000 px]] | ||
'''IMPORTANT''': if the Transmission follow up icon is not available on your screen, you might contact the e-file administrator of your company, who will add the module to your e-file account. | '''IMPORTANT''': if the Transmission follow up icon is not available on your screen, you might contact the e-file administrator of your company, who will add the module to your e-file account. | ||
| Line 20: | Line 35: | ||
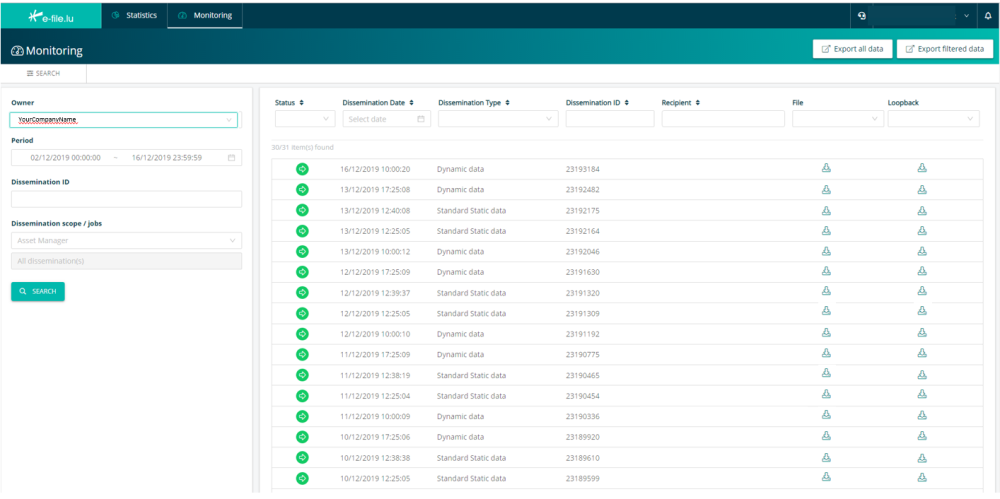
Result: The monitoring tab opens | Result: The monitoring tab opens | ||
[[File:The monitoring tab opens.PNG | border | | [[File:The monitoring tab opens.PNG | border | 1000 px]] | ||
=Monitoring Tab= | =Monitoring Tab= | ||
| Line 26: | Line 43: | ||
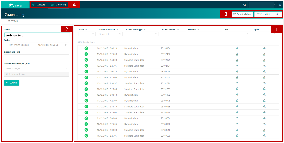
The screen is composed by 4 main areas: | The screen is composed by 4 main areas: | ||
1. Dissemination list | 1. Dissemination list<br /> | ||
2. Left filter panel | 2. Left filter panel<br /> | ||
3. Export buttons | 3. Export buttons<br /> | ||
4. Statistics and monitoring tabs | 4. Statistics and monitoring tabs<br /> | ||
[[File:Monitoring Tab.png | border | 1000 px]] | |||
==1. Dissemination list== | ==1. Dissemination list== | ||
| Line 39: | Line 57: | ||
List of disseminations performed recently. It is sorted per date and provides you with the following information: | List of disseminations performed recently. It is sorted per date and provides you with the following information: | ||
* Status of the dissemination | |||
[[File:Status of the dissemination.PNG | border | | [[File:Status of the dissemination.PNG | border | 1000 px]] | ||
* Dissemination Date: last (aggregated) data dissemination status time (and date) | |||
* Dissemination Type: type of data transferred (PRIIPS, MIFID, Documentary, Dynamic, Standard Static data) | |||
* Dissemination ID: unique number identifying the dissemination | |||
* Recipient: name of the recipient entity concerned by the dissemination | |||
* File: icon to directly download the output of the dissemination | |||
All columns can be filtered and sorted: | All columns can be filtered and sorted: | ||
* Filter: select in dropdown list or type in the free text box. The filter can be removed thanks to the cross appearing on the right of the cell | |||
* Sorting: small arrows in the tittle of the columns | |||
-One click: sort in ascending order | |||
-Two clicks: sort in descending order | |||
-Three clicks: cancel sorting | |||
[[File:All columns can be filtered and sorted.PNG | border | | [[File:All columns can be filtered and sorted.PNG | border | 1000 px]] | ||
| Line 67: | Line 85: | ||
The screen provides you with the details of a specific dissemination and its references | The screen provides you with the details of a specific dissemination and its references | ||
[[File:Dissemination details.png | border | | [[File:Dissemination details.png | border | 1000 px]] | ||
* The upper part is related to the specific dissemination | |||
* The below part provides you the references of the dissemination so that you can identify to which contract it is related | |||
* "Export details" allows you to download the information available on the screen in a CSV file | |||
* “Ask Fundsquare” allows you to contact Fundsquare to ask your questions about a specific dissemination | |||
===Loopback=== | ===Loopback=== | ||
Loopback is the process of ensuring that the static data disseminated by Fundsquare to the platforms is well integrated on their end. | Loopback is the process of ensuring that the static data disseminated by Fundsquare to the platforms is well integrated on their end. | ||
On the condition that you have signed for this service the loopback is being performed against the following platforms: | On the condition that you have signed for this service the loopback is being performed against the following platforms: | ||
*Bloomberg | |||
*Morningstar | |||
*Lipper | |||
*OPVCM360 | |||
*Fundinfo | |||
*Swiss Fund Data | |||
The loopback report can be found within the dissemination details screen of the dissemination dashboard monitoring tab. The link to the loopback report is located just below the link to the dissemination file of your static data. | The loopback report can be found within the dissemination details screen of the dissemination dashboard monitoring tab. The link to the loopback report is located just below the link to the dissemination file of your static data. | ||
| Line 98: | Line 118: | ||
Should you have any issues related to the new features please do not hesitate to contact us either via email or using the “Ask Fundsquare”, which is functionality already embedded in the dissemination details on the top right corner. | Should you have any issues related to the new features please do not hesitate to contact us either via email or using the “Ask Fundsquare”, which is functionality already embedded in the dissemination details on the top right corner. | ||
==2. Left filter panel== | ==2. Left filter panel== | ||
Filter applied on the entire list | Filter applied on the entire list | ||
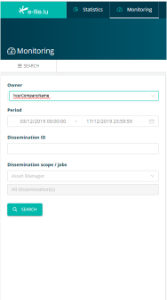
[[File:Left filter panel.png | border | 250 px]] | |||
* Owner: Library owner | |||
* Period: by default, the time frame is 2 weeks but it can be modified or extended (but is mandatory to launch the research) | |||
* Dissemination ID: research of a specific dissemination. The result should be a unique line in the dissemination list | |||
* Dissemination scope / jobs: | |||
1. Selection of one asset manager related to your company | |||
2. Selection of instruments (fund, sub-funds or ISIN) (by default selection of all) | |||
To apply the filters on the list, click on the "search" button | To apply the filters on the list, click on the "search" button | ||
The filter panel can be minimized by clicking on the "search" button above the panel () | The filter panel can be minimized by clicking on the "search" button above the panel () | ||
==3. Export buttons== | ==3. Export buttons== | ||
Export the data of the dissemination list in a csv format | Export the data of the dissemination list in a csv format | ||
"Export all data": export the list of dissemination no matter the filter(s) applied on the columns. | *"Export all data": export the list of dissemination no matter the filter(s) applied on the columns.<br /> | ||
Note: the filter(s) applied via the filter panel are taken into account in the export. | '''Note''': the filter(s) applied via the filter panel are taken into account in the export.<br /> | ||
"Export filtered data": export the list of dissemination with the filter(s) applied | |||
*"Export filtered data": export the list of dissemination with the filter(s) applied | |||
==4. Dashboard and monitoring tabs== | ==4. Dashboard and monitoring tabs== | ||
This buttons allows you to navigate from the monitoring tab (presented in this section) and the dashboard tab (presented in the next section). Before opening the dashboard tab, you have to select one Owner in the filter panel | This buttons allows you to navigate from the monitoring tab (presented in this section) and the dashboard tab (presented in the next section). Before opening the dashboard tab, you have to select one Owner in the filter panel | ||
=Statistics Tab= | =Statistics Tab= | ||
The metrics tab provides you with KPIs and quantitative data related to your disseminations | The metrics tab provides you with KPIs and quantitative data related to your disseminations | ||
| Line 136: | Line 172: | ||
Number of disseminations per Data Type | Number of disseminations per Data Type | ||
Total number of instruments / month in scope for dissemination | Total number of instruments / month in scope for dissemination | ||
==Graph linked to instruments== | ==Graph linked to instruments== | ||
===1. Instruments in scope vs. disseminated=== | ===1. Instruments in scope vs. disseminated=== | ||
'''Refresh''': once per day at 01:04 am | |||
'''Scope''': Evolution of total set of instruments within 12 last months | |||
'''Filter''': The graph can be filtered by products | |||
[[File:The graph can be filtered by products.png | border | 1000 px]] | |||
===2. Dissemination Done vs. Errors=== | ===2. Dissemination Done vs. Errors=== | ||
Scope: Number of dissemination successful vs number of dissemination in error | '''Refresh''': real time refresh on page reload (a cache refresh delay could be observed) | ||
'''Scope''': Number of dissemination successful vs number of dissemination in error | |||
The number in the center of the graph | The number in the center of the graph | ||
Filter: 2 filters can be applied: | '''Filter''': 2 filters can be applied: | ||
Periodicity: filter on the time frame you want to see (from current month to the entire year) | 1.Periodicity: filter on the time frame you want to see (from current month to the entire year)<br /> | ||
Status: Done or error | 2.Status: Done or error | ||
'''Additional information''': The figure in the center of the graph indicates the total number of dissemination (depending on the status displayed) | |||
[[File:The figure in the center of the graph.png | border | 1000 px]] | |||
===3. Instruments in scope vs. disseminated=== | |||
'''Refresh''': once per day at 01:04 am | |||
Refresh: once per day at 01:04 am | |||
Scope: Details about the total set of instruments and the instruments effectively disseminated | '''Scope''': Details about the total set of instruments and the instruments effectively disseminated | ||
Filter: The graph can be filtered by periodicity (from current month to the entire year) | '''Filter''': The graph can be filtered by periodicity (from current month to the entire year) | ||
Additional information: The information displayed reflects the information displayed in the graph 1 (Evolution of total set of instruments within 12 last months). | Additional information: The information displayed reflects the information displayed in the graph 1 (Evolution of total set of instruments within 12 last months). | ||
For current month and last month views: | *For current month and last month views: | ||
The figure "in scope" is the total number of instruments. It is equal to the respective bar on the first graph (orange+green) | - The figure "in scope" is the total number of instruments. It is equal to the respective bar on the first graph (orange+green)<br /> | ||
The figure "disseminated" is the total number of instruments disseminated. It is equal to the respective green bar on the first graph (orange+green) | - The figure "disseminated" is the total number of instruments disseminated. It is equal to the respective green bar on the first graph (orange+green) | ||
For last 3 months, last half year and one year last month views: | |||
The figure "in scope" is the total number of instruments. It should remain the same unless instruments have been added or withdrawn from the contracts | |||
The figure "disseminated" is the sum of instruments disseminated during the time frame selected | *For last 3 months, last half year and one year last month views: | ||
- The figure "in scope" is the total number of instruments. It should remain the same unless instruments have been added or withdrawn from the contracts<br /> | |||
- The figure "disseminated" is the sum of instruments disseminated during the time frame selected | |||
[[File:The figure disseminated.png | border | 1000 px]] | |||
==Graph linked to disseminations== | ==Graph linked to disseminations== | ||
=== Total number of successful disseminations / month=== | === Total number of successful disseminations / month=== | ||
Scope: Number of dissemination successfully delivered | '''Refresh''': real time refresh on page reload (a cache refresh delay could be observed) | ||
'''Scope''': Number of dissemination successfully delivered | |||
Filter: No filter applicable | '''Filter''': No filter applicable | ||
[[File:Total number of successful disseminations.png | border | 1000 px]] | |||
==Graph linked to data types== | ==Graph linked to data types== | ||
===Number of instruments per Data Type=== | ===Number of instruments per Data Type=== | ||
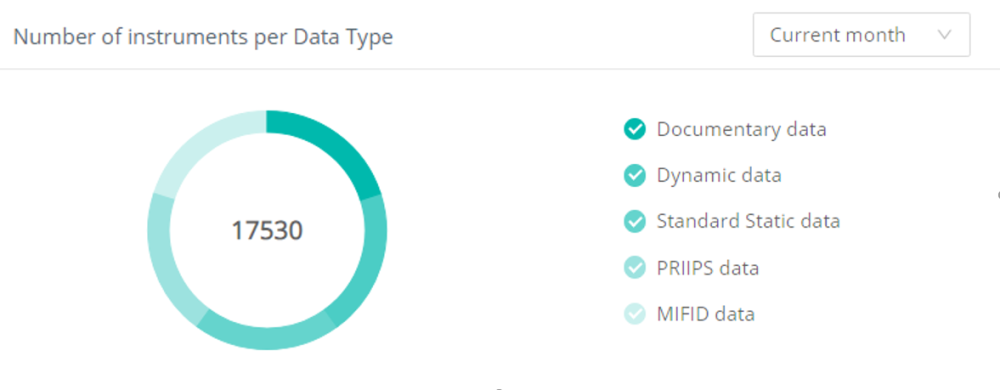
'''Refresh''': once per day at 01:04 am | |||
'''Scope''': Split of the instruments depending on the data type | |||
'''Filter''': 2 filters can be applied: | |||
1.Periodicity: filter on the timeframe you want to see (from current month to the entire year) | |||
<br> | |||
2.Data types: PRIIPS data, MIFID data, Documentary data, Dynamic data, Standard Static data | |||
'''Additional information''': The figure in the center of the graph indicates the total number of instruments (depending on the data types selected) | |||
[[File:Number of instruments per Data Type.png | border | 1000 px]] | |||
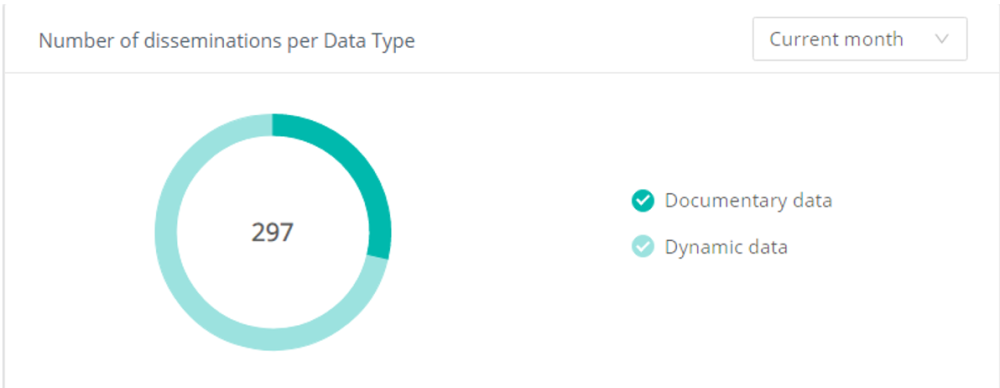
===Number of disseminations per Data Type=== | ===Number of disseminations per Data Type=== | ||
'''Refresh''': real time refresh on page reload (a cache refresh delay could be observed) | |||
'''Scope''': Number of disseminations split per data type | |||
'''Filter''': 2 filters can be applied: | |||
1. Periodicity: filter on the timeframe you want to see (from current month to the entire year)<br> | |||
2. Data Types: PRIIPS data, MIFID data, Documentary data, Dynamic data, Standard Static data | |||
Additional information: The figure in the center of the graph indicates the total number of disseminations (depending on the data types selected) | [[File:Number of disseminations per Data Type.png | border | 1000 px]] | ||
'''Additional information''': The figure in the center of the graph indicates the total number of disseminations (depending on the data types selected) | |||
The information displayed reflects the information displayed in the graph 4 (Total number of successful disseminations / month), if all data types are displayed (no product filter) | The information displayed reflects the information displayed in the graph 4 (Total number of successful disseminations / month), if all data types are displayed (no product filter) | ||
===Total number of instruments / month in scope for dissemination=== | ===Total number of instruments / month in scope for dissemination=== | ||
Scope: Total number of distinct instruments in contracts and evolution in time | '''Refresh''': once per day at 01:04 am | ||
'''Scope''': Total number of distinct instruments in contracts and evolution in time | |||
'''Filter''': No filter applicable | |||
[[File:Total number of instruments.png | border | 1000 px]] | |||
Latest revision as of 10:22, 4 February 2025
Page's last update : 22 February 2024
FAQ
Your module is greyed out?
- To get access to this module, please ask your e-file local administrator to make you member of the Dissemination dashboard group.
What is the purpose of this module ?
- The objective of this module is to give you an overview of the disseminations done. The information are split between two screens:
- Monitoring:
- List of the dissemination with status, date and time, type of data, and possibility to download the file
- If you click on one specific line, you have access to the dissemination details such as the distribution channel, the recipient list, the format of the file and the reference of the dissemation (subscription number and name and contract number and name)
- Monitoring:
- Dashboard:
- Set of graphs providing statistics related to products, dissemination, dissemination status and instruments
How to access the Dissemination follow-up screen
Step 1: Click on the Dissemination follow-up icon
IMPORTANT: if the Transmission follow up icon is not available on your screen, you might contact the e-file administrator of your company, who will add the module to your e-file account.
Result: The monitoring tab opens
Monitoring Tab
The screen is composed by 4 main areas:
1. Dissemination list
2. Left filter panel
3. Export buttons
4. Statistics and monitoring tabs
1. Dissemination list
Refresh: real time refresh on page load (a cache refresh delay could be observed)
List of disseminations performed recently. It is sorted per date and provides you with the following information:
- Status of the dissemination
- Dissemination Date: last (aggregated) data dissemination status time (and date)
- Dissemination Type: type of data transferred (PRIIPS, MIFID, Documentary, Dynamic, Standard Static data)
- Dissemination ID: unique number identifying the dissemination
- Recipient: name of the recipient entity concerned by the dissemination
- File: icon to directly download the output of the dissemination
All columns can be filtered and sorted:
- Filter: select in dropdown list or type in the free text box. The filter can be removed thanks to the cross appearing on the right of the cell
- Sorting: small arrows in the tittle of the columns
  -One click: sort in ascending order
  -Two clicks: sort in descending order
  -Three clicks: cancel sorting
Dissemination details
Refresh: real time refresh on page load.
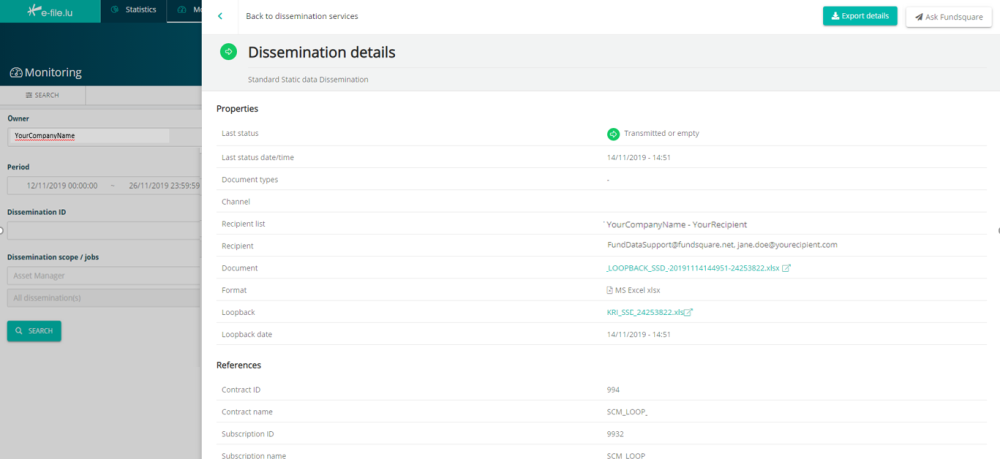
The screen provides you with the details of a specific dissemination and its references
- The upper part is related to the specific dissemination
- The below part provides you the references of the dissemination so that you can identify to which contract it is related
- "Export details" allows you to download the information available on the screen in a CSV file
- “Ask Fundsquare” allows you to contact Fundsquare to ask your questions about a specific dissemination
Loopback
Loopback is the process of ensuring that the static data disseminated by Fundsquare to the platforms is well integrated on their end.
On the condition that you have signed for this service the loopback is being performed against the following platforms:
- Bloomberg
- Morningstar
- Lipper
- OPVCM360
- Fundinfo
- Swiss Fund Data
The loopback report can be found within the dissemination details screen of the dissemination dashboard monitoring tab. The link to the loopback report is located just below the link to the dissemination file of your static data.
This report will show you the level of accuracy of your data in each platform the loopback was performed against, based on the latest dissemination of your static data. You will be able to check the scope of ISINs that were in scope for the loopback. The weight of the accurate data, together with the weight of the ones that were not found to be accurate on the platforms and the ones that even though they were disseminated they were ignored.
The report also gives you evidence on which ISINs the issues appeared and which were the affected fields.
The Fund Life Cycle is also enriched to show the evolution of the loopback throughout the period of one year in two separate screens. The first one is the Loopback Scope, in which you can check the evolution of the instruments’ scope by platform for which the loopback has been carried out.
The second one, which is the Data Points screen, will enable you to monitor the evolution of the accuracy of your static data per platform against which the Loopback has been performed.
Should you have any issues related to the new features please do not hesitate to contact us either via email or using the “Ask Fundsquare”, which is functionality already embedded in the dissemination details on the top right corner.
2. Left filter panel
Filter applied on the entire list
- Owner: Library owner
- Period: by default, the time frame is 2 weeks but it can be modified or extended (but is mandatory to launch the research)
- Dissemination ID: research of a specific dissemination. The result should be a unique line in the dissemination list
- Dissemination scope / jobs:
  1. Selection of one asset manager related to your company
  2. Selection of instruments (fund, sub-funds or ISIN) (by default selection of all)
To apply the filters on the list, click on the "search" button
The filter panel can be minimized by clicking on the "search" button above the panel ()
3. Export buttons
Export the data of the dissemination list in a csv format
- "Export all data": export the list of dissemination no matter the filter(s) applied on the columns.
Note: the filter(s) applied via the filter panel are taken into account in the export.
- "Export filtered data": export the list of dissemination with the filter(s) applied
4. Dashboard and monitoring tabs
This buttons allows you to navigate from the monitoring tab (presented in this section) and the dashboard tab (presented in the next section). Before opening the dashboard tab, you have to select one Owner in the filter panel
Statistics Tab
The metrics tab provides you with KPIs and quantitative data related to your disseminations
These data are related to instrument, dissemination or recipient. The list of graphs available are:
Instruments in scope vs. disseminated Dissemination Done vs. Errors Instruments in scope vs. disseminated Total number of successful disseminations / month Number of instruments per Data Type Number of disseminations per Data Type Total number of instruments / month in scope for dissemination
Graph linked to instruments
1. Instruments in scope vs. disseminated
Refresh: once per day at 01:04 am
Scope: Evolution of total set of instruments within 12 last months
Filter: The graph can be filtered by products
2. Dissemination Done vs. Errors
Refresh: real time refresh on page reload (a cache refresh delay could be observed)
Scope: Number of dissemination successful vs number of dissemination in error
The number in the center of the graph
Filter: 2 filters can be applied:
1.Periodicity: filter on the time frame you want to see (from current month to the entire year)
2.Status: Done or error
Additional information: The figure in the center of the graph indicates the total number of dissemination (depending on the status displayed)

3. Instruments in scope vs. disseminated
Refresh: once per day at 01:04 am
Scope: Details about the total set of instruments and the instruments effectively disseminated
Filter: The graph can be filtered by periodicity (from current month to the entire year)
Additional information: The information displayed reflects the information displayed in the graph 1 (Evolution of total set of instruments within 12 last months).
- For current month and last month views:
- The figure "in scope" is the total number of instruments. It is equal to the respective bar on the first graph (orange+green)
- The figure "disseminated" is the total number of instruments disseminated. It is equal to the respective green bar on the first graph (orange+green)
- For last 3 months, last half year and one year last month views:
- The figure "in scope" is the total number of instruments. It should remain the same unless instruments have been added or withdrawn from the contracts
- The figure "disseminated" is the sum of instruments disseminated during the time frame selected
Graph linked to disseminations
Total number of successful disseminations / month
Refresh: real time refresh on page reload (a cache refresh delay could be observed)
Scope: Number of dissemination successfully delivered
Filter: No filter applicable
Graph linked to data types
Number of instruments per Data Type
Refresh: once per day at 01:04 am
Scope: Split of the instruments depending on the data type
Filter: 2 filters can be applied:
1.Periodicity: filter on the timeframe you want to see (from current month to the entire year)
2.Data types: PRIIPS data, MIFID data, Documentary data, Dynamic data, Standard Static data
Additional information: The figure in the center of the graph indicates the total number of instruments (depending on the data types selected)
Number of disseminations per Data Type
Refresh: real time refresh on page reload (a cache refresh delay could be observed)
Scope: Number of disseminations split per data type
Filter: 2 filters can be applied:
1. Periodicity: filter on the timeframe you want to see (from current month to the entire year)
2. Data Types: PRIIPS data, MIFID data, Documentary data, Dynamic data, Standard Static data
Additional information: The figure in the center of the graph indicates the total number of disseminations (depending on the data types selected)
The information displayed reflects the information displayed in the graph 4 (Total number of successful disseminations / month), if all data types are displayed (no product filter)
Total number of instruments / month in scope for dissemination
Refresh: once per day at 01:04 am
Scope: Total number of distinct instruments in contracts and evolution in time
Filter: No filter applicable
